Mikhail Alexandrov, Alexander Gelbukh, Pavel Makagonov. On Metrics for Keyword-Based Document Selection and Classification. Proc. CICLing-2000, International Conference on Intelligent Text Processing and Computational Linguistics, February 13-19, 2000, Mexico City. CIC-IPN, ISBN 970-18-4206-5.
On Metrics for Keyword-Based
Document Selection and Classification
M. Alexandrov
A. Gelbukh
P. Makagonov
For a large set of documents, certain numerical characteristics (metrics) are discussed that allow to select the documents relevant to a given topic and divide the set of the relevant documents into several groups (clusters) reflecting various sub-topics of the given topic. The choice of the metrics is justified by expected results for known examples. A given topic is defined by a domain-oriented keyword dictionary. The results are implemented in a program Text Classifier.
1 Introduction
1.1 Practical tasks
Consider a Program Committee of a large congress that receives many hundreds or thousands of submissions. The first problem to be solved is to select from them the texts that are related to the main topic of the congress. Then these texts are to be subdivided into several groups (clusters). Usually the number of such clusters is known in advance since they reflect various sub-topics by the main topic of the congress. These clusters of texts will be a base for the future sections or subsection of the congress.
Another example is the search for the data on some specific problem in a large digital library. Here also first of all, the relevant documents are to be selected, and on the second step they are to be clustered so that the clusters would represent some subtopics or aspects of the given topic. Then the specialist can select the cluster that is most interesting to him or her at the given moment and ignore all other documents. In this situation the number of clusters is unknown a priori.
Also, clusterization of the relevant information is a tool for extracting hidden knowledge from the data. Organization of the data in clusters allows the user to form hypotheses about the possible reasons for such grouping [Andriaans, 1997].
As a set of documents for the examples given in this paper, we use the interviews of 32 ecologists interviewed by the experts of Moscow City Administration. The interviews are from 2400 to 11700 words long. A DD for the domain under consideration was prepared. A priori it was known that among the ecologists there were three groups of specialists: journalists writing on the ecology, administrators engaged in the organization of ecological actions, and scientists. The problem consisted in selection of relevant material and its classification for further consideration by the specialists of Moscow City Administration.
1.2 Computer aided document selection and classification
The tasks described above are typical for many applications. In the procedure of solving of such a task there is a common element, namely, selection of two thresholds: the one for the selection of the relevant documents and another one for their subdivision into clusters. Also, a formal implementation of the mentioned operations needs some metrics that would allow evaluating a degree of relation between a document and a topic under consideration, as well as between different documents.[1] There are various subjective considerations both in constructing such metrics and in selection of the thresholds. Therefore, no program can formally solve such problems on its own. However, a program can make the process of decision making more objective if it transforms the subjective user’s notions into formally calculated characteristics, basing on which the used makes his or her informal decisions. Specifically, a program should provide to the user the possibility:
· to use various characteristics reflecting the user’s system of preferences with respect to the contents of the documents,
· to suppress the “hurricane” (too high) values that reflect non-uniformity of the document set and distort the obtained results.
Besides, the software should provide a possibility to verify the stability of the results as an indirect indicator of their correctness.
These desiderata were taking into account in the development of the program Text Classifier for selection and classification of documents. It was designed to be used by large variety of end users in their everyday work, rather than by specially trained experts. This paper describes some features of Text Classifier, in particular, various metric relations used in the program.
2 Numerical representation of a document
2.1 Domain dictionary
The metrics mentioned above can be constructed in two ways: directly using the textual form of the document, or basing on its intermediate numerical representation. We use the latter way. One can suggest various numerical representation of the document: for example, a list of its words with their respective frequencies, such a list normalized by the size of the document, etc. However, such representations based directly on the words of the documents are not convenient for document comparison since different documents have different vocabularies. One could then suggest restrict the words included in such word lists for the documents to the general lexicon, for example, to the top 6000 most frequently used words (the total probability of the appearance of such words in documents in European languages is about 0.7), which would be a quite complete numerical representation of textual document. However, this way has some essential drawbacks:
· The majority of the words specific for the topic under consideration can be absent in the general lexicon, so such numerical representation will not be relevant for the topic at hand. Analogously, the majority of the words used in the documents relevant to some specific narrow topic can be absent in the general lexicon;
· The majority of words of the general lexicon are absent in a specific document because of its limited size, so that the resulting frequency vector would be too sparse and its high dimension not justified.
Besides, such a method considers all words from the general lexicon independent from each other and does not consider stable word combinations, while every specific domain usually has its own set of such stable combinations.
Thus, since only the following characteristics are relevant for our discussion:
· the relation between a document and a given topic, and
· the relation between different documents within the same topic,
a more preferable representation is a list of the words or word combinations contained in the document, with their respective frequencies, restricted to the words and word combinations relevant for the topic at hand.
In our work, a special form of a keyword list relevant for a given topic called a domain dictionary (DD) is used. It is described in detail in our paper [Alexandrov 2000] published in the same volume.
Every DD defines an appropriate domain. It is natural that some subset of keywords from this DD defines some appropriate sub-domain. This list of keywords can be considered as a sub-DD.
Any selection and classification results obtained with keyword lists are very sensible to the contents of the DD. Thus the compilation of such DDs requires a special technology and a very careful work. An appropriate technology is described in [Makagonov 1999]. DDs have demonstrated their advantages for the definition of thematic structure for Spanish [Guzman-Arenas 1998], English, and Russian [Makagonov 1999] documents.
2.2 The image and the theme of a document
Using a DD, for every document so-called document image can be built with respect to the appropriate domain. Such an image is a list of the domain-specific keywords with their respective numbers of occurrences in the given document. Obviously, the document image depends on the specific DD, so that one and the same document has many images, one for every DD.
Hereafter in this paper it will use the word domain as a formal term for a topic defined as a specific DD. We will use the term theme of the document to refer to the characteristics reflecting the contents of a specific document.
Given a DD, each document image can be considered as a vector (X1, X2, ..., Xk, ..., XN) in the multidimensional space with the dimensions corresponding to the keywords of the DD; this vector corresponds to the theme of the given document. All documents reflecting the same theme have parallel vectors. Indeed, let us consider the document nd obtained as a concatenation of n copies of the given document d. Naturally, it has the same theme as d, while its image (nX1, nX2, ..., nXk, ..., nXN) is parallel to that of d. On the other hand, let us consider a document d' that has no relation to the domain under consideration, and attach it to source one d. Naturally, the resulting text d + d' has the same theme with respect to the domain under consideration as d, while it has the same image which thus is parallel to that of d.
3 Selection of relevant documents
3.1 Weight of a document
We use the absolute document weight for evaluation of total amount of information on the domain in a document. Let (X1, X2, ..., Xk, ...) be the image of a document d for the given domain and (A1, A2, ..., Ak, ...) be the coefficients of importance for the corresponding keywords in the DD. Then absolute document weight can be calculated according in different ways. The simplest variant is the following:
![]() , (1)
, (1)
where N is the size of the DD. This measure has the important property of being additive with respect to the sub-domains reflected in the document. Namely, let a DD of N keywords is subdivided into two non-intersecting subDDs of K1and K2keywords, respectively, where K1 + K2 = N. As it was mentioned in the section 1.2 above, these subDDs define two different sub-domains. According the formula (1), the total amount of the information for to these sub-domains in the document equals to the total amount of the information for the whole domain. This corresponds to the intuition about the contribution of sub-domains in their common domain. Some other possible measures, for instance, the quadratic one:
![]() , (2)
, (2)
are not additive with respect to sub-domains.
Linear measure (1) reflects the total
amount of the relevant information in the document. However, our purposes are
different: to evaluate the correspondence of the document to the domain and to
compare two documents. In this case, the absolute document weight should be
normalized by the document size. For this, we consider a 1000 word document as
a standard size. If our real document contains M words then the
normalizing coefficient is 1000/M, and the relative weight of the
document is 1000![]() , where W is defined as (1). With this,
concatenation of several copies of the same document d into a new document
nd has the same relative weight as d. On the other hand,
concatenation of d with another document d' which has the same length
but no relevance for the given domain has the relative weight twice less than d.
This corresponds to the intuitive notion of the share of the text occupied by a
given domain, or a density of the given domain in the given text.
, where W is defined as (1). With this,
concatenation of several copies of the same document d into a new document
nd has the same relative weight as d. On the other hand,
concatenation of d with another document d' which has the same length
but no relevance for the given domain has the relative weight twice less than d.
This corresponds to the intuitive notion of the share of the text occupied by a
given domain, or a density of the given domain in the given text.
Hereafter, we will use only relative document weight without specifically indicating this.
3.2 Relevance measure
Now we are almost ready to define the quantitative measure for the relevance of a given document for the given domain. To begin with, let us first suppose that all coefficients of importance are equal to 1, which means that all keywords are equally important for the given domain. Then the normalized weight is equal to the number of the domain-specific keywords per 1000 words of the document.
In usual practice the experts working with DDs use, on the basis of their experience, the following criteria – which we below will show to be insufficient:
· A document has a good relevance for the given domain if it contains at least 1 keyword per approximately each 2 or 3 phrases;
· A document is irrelevant for the given domain if it contains less than 1 keyword per approximately 10 or 15 phrases;
· Otherwise, the document has some relation to the domain.
In all European languages, phrases contain on the average about 7 words. Thus, these estimations can be rephrased as follows:
·
Good relevance: more then 50 keywords
per 1000 words, i.e., 50![]() ;
;
·
No relevance: less than 10 keywords
per 1000 words, i.e., 10![]() ;
;
·
Some relevance: between 10![]() and 50
and 50![]() ,
,
where ![]() stands for per
mille. This gives an approximate evaluation of the weight for definition of
document relevance: relevant documents have the weight more then 50, irrelevant
documents less than 10, and the documents with the weight from 10 to 50 belong
to the intermediate case.
stands for per
mille. This gives an approximate evaluation of the weight for definition of
document relevance: relevant documents have the weight more then 50, irrelevant
documents less than 10, and the documents with the weight from 10 to 50 belong
to the intermediate case.
In the general case of arbitrary importance coefficients Ak the same numerical values for the weight W calculated by (1) can be used. Really, one occurrence of a word with an importance coefficient Ak can be considered as the corresponding fraction of one occurrence of a word with the coefficient 1, i.e., e.g., two occurrences of a word with Ak = 0.5 correspond to one occurrence of a word with Ak = 1. Thus, with the coefficients less than 1, the same weight corresponds to a larger number of occurrences of the keywords.
Actually, the document weight is not the only characteristic important to distinguish documents relevant for the domain from the irrelevant ones. The relevance of the document for the domain is defined through both the document weight W (that reflects the coverage of the document by the DD and thus can be called document coverage) and the coverage of the DD by the document (which we will call dictionary coverage). These two characteristics are independent from each other and have orthogonal meaning: one of them expresses a quantitative result while the other its reliability; for the resulting probabilistic measure they are combined together.
Really, if only one keyword from the DD is repeated many times in the document, then the relevance of this document for the domain is at least doubtful. For example, a text that many times mentions the word agent has a high weight W for a DD on modern computer science, while it very well can be a detective story having nothing to do with software agents. The dictionary coverage is defined through the number of keywords from the DD that have occurred in the text at least once:[2]
· Good coverage: more then 75% keywords of the DD are used;
· Poor coverage: less than 25% keywords of the DD are used;
· Intermediate case: between 25% and 75%.
If the document very extensively uses less than 25% keywords of the DD then, in spite of that it has poor overall coverage of the DD, it may be very relevant for some appropriate sub-domain of the given domain (though if the used subset is too small it can as well have nothing to do with the domain).
In summary, to decide how probable it is that the given document is relevant to the given domain, these two orthogonal pieces of information – the measure and its reliability – are to be combined. The empirical combination recommended to the users is given in the Table 1. We do not consider here the intermediate cases; the conclusion for those cases is not reliable.
|
Table 1. Subjective estimations of relevance.
|
||
|
Document |
Dictionary |
Conclusion |
|
Good |
Good |
Good relevance for the domain. |
|
Good |
Poor |
Good relevance for a sub-domain.[3] |
|
Poor |
Good |
No reliable conclusion can be made. |
|
Poor |
Poor |
No relevance for the domain. |
Therefore, the user should use simultaneously two characteristics of the text – the weight and the dictionary coverage – in order to make the decision about the relevance of the document to a given domain.
3.3 Example
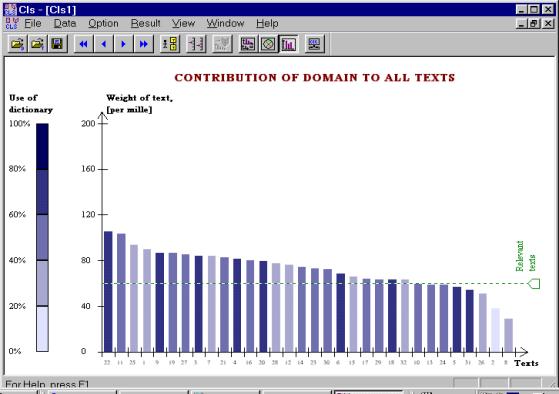
Figure 1 shows the weights and dictionary coverage for the set of the interviews mentioned in the section 1.1. Every vertical bar in the histogram represents one document. The height of the bar reflects the weight of the document, while the dictionary coverage is represented visually by the saturation of its color: the documents with poor dictionary coverage are shown in a semi-transparent color that indicates their weakness, while those with good dictionary coverage are shown in a strong color.
In Figure 1, the threshold for the weight (represented by a horizontal dotted line) is set to 60; nearly all documents have the weight greater than 60 and thus are considered potentially relevant, though the documents number 10, 13, 24, 5, 31, 26, 2, 8 that form the right part of the histogram are rejected. The documents 25, 1, 7, 28, 12, 15, 32, though are accepted as possibly relevant reflect some sub-domains rather than the whole domain; this group of documents needs to be further investigated for the decision on their relevance to be made in each case individually.
4 Classification of relevant documents
4.1 Distance between documents
The vector form for representation of the document images gives the formal possibility to apply some traditional metric relations used in mathematics, though their use is to be justified. Such a justification can consist in comparison of the results of such application with the results on known examples.
Let (X11, X21, ..., Xk1, ...) and (X12, X22, ..., Xk2, ...) be the images of two documents, and (A1, A2, ..., Ak, ...) the coefficients of importance for the appropriate keywords. If the documents have the same length then the distance D between them may be measured using the following metrics:
· Correlative metric
 (3)
(3)
· Euclidean metrics of various degrees:
![]() ,
, ![]() , (4)
, (4)
and in general for an arbitrary p=1, 2, 4, ..., ¥:
![]() . (5)
. (5)
|
Figure 1. Weight and dictionary coverage of the documents for a domain. |
If the documents have different sizes M1
and M2
then the same formulas can be used, but instead of the usual coordinates ![]() and
and ![]() the following normalized values are to be substituted:
the following normalized values are to be substituted:
![]() = 1000
= 1000 ![]()
![]() ,
, ![]() = 1000
= 1000 ![]()
![]() (6)
(6)
These metrics reflect various approaches to the notion of closeness between documents. Really, a document image (with or without normalization) defines some vector in the space of the keywords, the direction of which corresponds to a specific theme of the document with respect to the given domain, while the length of the vector corresponds to the contribution of the domain to the document.
The correlative metric defines the angle between the document images. It does not depend on their lengths, i.e., on the density of the keywords. So the correlative metric reflects the difference between the themes in the documents. Indeed, if we concatenate a document d with another document d' that has no relation to the domain under consideration and thus does not change the theme of d, then the correlative distance between the documents d + d' and d is equal to 0, i.e., these documents are identical. In other words, the correlative measure does not depend on the noise in the documents. This result corresponds to the intuition about the closeness between the thematic structures of two documents.
The Euclidean metrics depend on both the angle between the document images and their lengths. If two documents reflect the same theme or close themes then the Euclidean metrics depend only on the difference of their lengths, i.e., on the absolute contribution of the domain to these documents. Thus, in case of the documents with similar thematic structures the Euclidean metrics reflect the difference of domain contribution to the documents. In the previous example, if d' has the same length as d then the Euclidean distance between d + d' and d is half of the length of d, i.e., half of the absolute domain contribution to d, as naturally expected, while the distance between d' and d is equal to the length of d (note that the correlative measure is not defined for d').
|
Figure 2. Closeness between themes and between domain contributions. |
In Figure 2, a geometric illustration of the correlative and Euclidean metrics is shown, where a and b are the two document image vectors.
When discussing the relations between documents, the textual nature of documents is to be taken into consideration. In particular, if the document image is the zero vector, the document has no relation to the domain under consideration and consequently all binary operations of this vector and any other one have no sense. No meaningful distance is defined between two documents if one of them has zero image.
The fuzzy nature of the DD probably allows the application of various metrics for fuzzy clustering [Klawonn, 1995]. However, a serious problem in such application would be the testing of their validity [Windham, 1981].In this paper, we do not consider fuzzy clustering.
4.2 Strategy of building the clusters
To build the clusters, the user should set up two thresholds: the one for the weight of the documents considered relevant and the other for the level of closeness between two documents for them to belong to one cluster.
The threshold for the document weight can be set on the basis of characteristics considered in the section 3. All documents that have the weight more then such a threshold are considered relevant, the clusters being built only of such relevant documents.
The threshold for the closeness allows to remove from consideration all weak links between the documents and to isolate the groups of the related documents, that have no links with other groups. Closeness C is the inverse value to the distance defined in percents:
C = (1 – D / Dmax) 100%,
where D is the distance between the documents and Dmax is the maximum of the possible distances between the documents in the given set of documents. The distance D is determined according to (3) to (6). Such representation of closeness allows assigning the level of closeness for clustering in percentage.
|
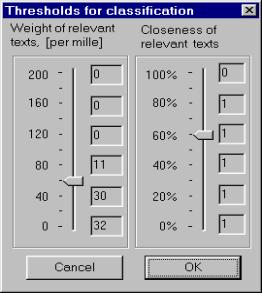
Figure 3. Parameters
for definition of functional scale |
Selecting the correct threshold for closeness is more difficult than the threshold for the document weights. Usually various scales, various metrics, and their combinations are to be tried. What is more, various DDs can be tried since relevant clustering can be found with another domain.
4.2.1 Functional scales
In a non-uniform document set (which is the most frequent and important case), the distance distribution between the documents also is very non-uniform, with many “hurricane” (too high) values that distort the overall picture. In practice, the documents producing these hurricane values usually are ignored, that causes the information about the structure of the document set to be lost. In Text Classifier, the distance between documents is measured using so-called functional scales that preserve the ordering on the axis of distances but suppress the hurricane values by scaling them down. As a functional scale D' for the distance D, various inverse degree functions can be used:
![]() , where
p = 2, 3, 4, ...
, where
p = 2, 3, 4, ...
Also the logarithmic function
![]()
can be used. All these transformations do not distort the picture in the neighborhood of the zero distance which is the most interesting for clustering:D' » D when D » 0. With this, the user can see the fine structure of the document set in a given neighborhood. On the other hand, the high values are not lost, i.e., the global structure with the hurricane values is preserved.
Earlier versions of Text Classifier program provided the user the possibility to work with all mentioned functional scales. However, we found that our users preferred to use only either ordinary scale or logarithmic functional scale probably due to that they are easier understandable. In the current version the other scales are available only in the expert user mode, not to confuse the less advanced users.
4.2.2 Variation and combination of metrics
The procedure of decision-making in the process of clusterization is essentially more subjective than in the task of mere selection of the relevant documents. For such decision-making to be more objective, the program should take into account the preferences of the user with respect to the document closeness. Also it should check the stability of the results.
Text Classifier program offers two metrics for evaluation of the distance between documents that were described in the section 4.1. If the user prefers to evaluate the closeness between documents by considering first the closeness between their thematic structures then the correlative metric is to be chosen. If the user prefers to evaluate the closeness between documents by considering first the closeness of the domain contributions then the Euclidean metric is used. However, in practice it is often desirable to combine both considerations, to define the closeness between two documents as their closeness both in the absolute domain contributions and in the thematic structure, with some coefficients of importance of these two considerations. This can be achieved with a combination of metrics:
D = a ´ Dc + b ´ De , where a + b =1.
Here Dc and De arethe distances between the documents in the correlative and the Euclidean metrics, respectively; aandbare the coefficients of preference – the penalties for the difference in the thematic structures and the absolute domain contributions, respectively. Usually in practice we set a = b = 1 (after automatic normalization they become a = b = 0.5), i.e., the difference in the thematic structure and the additional “chatter” in the documents have the same penalties.
Text Classifier program offers various variants of the Euclidean metric (5). By increasing the degree p the user can emphasize the contribution of large differences in the occurrences of some keywords. This metric is sensible to the “hurricane” values of the keywords.
|
(a) (b)
Figure 4. Setting thresholds for document weight and for closeness between documents: (a) – using ordinary scale, (b) – using logarithmic scale |

The Euclidean metric of any degree is stronger than the correlative one, i.e., if the distance between some documents is equal (or close) to 0 for the Euclidean metric then the distance between these documents is also equal (or close) to 0 for correlative metric, but vice versa. However, the correlative metric is important because of the following considerations. First, the Euclidean metric (if it is used not in combination with the correlative one) does not allow emphasizing the closeness of the themes in the documents. Second, the Euclidean metric does not allow to discover the fine structure of the document set: the majority of links turn out to be weak and therefore the user has to choose a low threshold for closeness so that almost all documents turn out to be interconnected, that in effect makes non-trivial clustering impossible.
4.2.3 Automatic prediction of the parameters
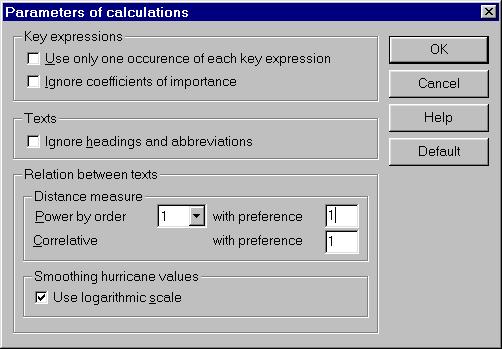
Figure 3 shows various options that allow the user to select the mode of functional scale and to construct a combination of metrics. Figure 4 illustrates the procedure of threshold selection. The left-side scale defines the document weight threshold; the right-side scale the threshold for the closeness between documents. To simplify the selection of the thresholds by user the program Text Classifier automatically pre-calculates and shows to the user in a concise form the following expected results for the possible values of the thresholds:
· The number of the relevant documents for the weight threshold; they are shown to the right of the left-side scales in Figure 4,
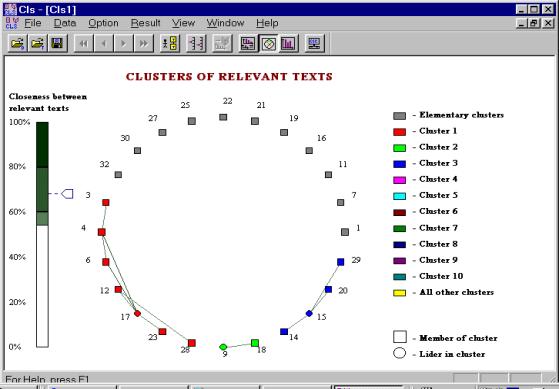
|
Figure 5. Clusters for the linear metric (weight threshold is 60, closeness threshold is 55). |
· The number of the clusters for the closeness threshold with the current value of the weight threshold; these numbers are shown to the right of the right-side scales in Figure 4.
These
values are calculated automatically for some grid of the possible positions of
the corresponding control elements; in Figure 4, for the values of 0, 40,
80, 120, 160, and 200![]() of the weight threshold, and for the values of 0, 20,
40, 60, 80, and 100% for the closeness threshold.
of the weight threshold, and for the values of 0, 20,
40, 60, 80, and 100% for the closeness threshold.
Of course, such dynamic hints correspond to the current settings for the functional scale and metric. In Figure 4 (a) they were calculated for ordinary scale and in Figure 4 (b) for logarithmic one. Both cases correspond to the example described in the section 1.1 (ecological interviews).
High level of subjectivity in our definitions may set forth the problem of cluster validation. It may be particularly important to make some tests on the absence of the class structure. In this paper, we do not consider this question, for some suitable methods see [Jolliffe 1988; Gordon 1996].
4.3 Practical example
For the example with the interviews of ecologists, let us first consider the weight threshold equal to 60; this gives 24 relevant documents, see Figure 1. According to the preliminary information about the interviewed persons, it 3 non-trivial clusters of documents are to be built. Note that a cluster may consist of only one element; these are trivial clusters. In our example the presence of trivial clusters was expected because of the following:
· Some ecologists spoke of many aspects of the problem at the same time,
· Some ecologists presented original views on the problem.
|
Figure 6. Clusters for a combination of the linear and the correlative metrics (weight threshold is 60, closeness threshold is 62) |
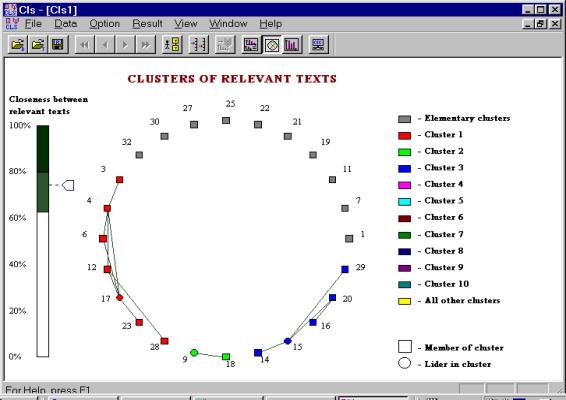
Figure 5 illustrates the result of clustering with the linear metric. There are three non-trivial clusters: (3, 4, 6, 12, 17, 28), (9, 18), and (14, 15, 20, 29). Figure 6 illustrates the result of clustering with a combined metrics, the linear and the correlative ones (with a = b = 0.5). There are the following non-trivial clusters: (3, 4, 6, 12, 17, 28), (9, 18), and (14, 15, 16, 20, 29).
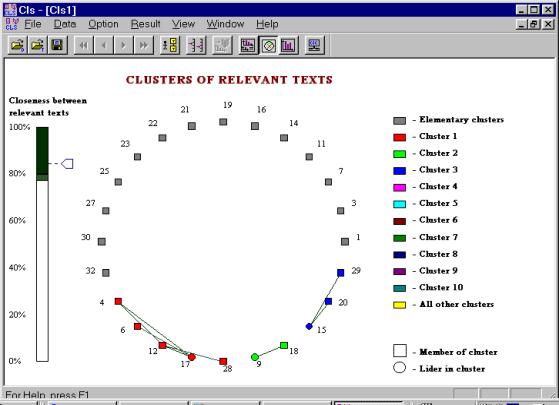
Finally, Figure 7 shows the clusters for the pure correlative metric: (4, 6, 12, 17, 28), (9, 18), and (15, 20, 29). The contents of the clusters almost do not depend on the metric used, that indicates a good stability of the results. As for the trivial clusters (independent ecologists), almost all of them have rather high weight (see Figure 1) and they need individual investigation.
5 Conclusions and future work
The problem of evaluating the relation between document and a given domain, as well as between two documents has been considered. Its solution is possible on the basis of a domain dictionary containing domain-specific keywords. Some metric relations that help to solve the problems of relevant document selection and their clustering have been suggested and justified.
|
Figure 7. Clusters for the correlative metric (weight threshold is 60, closeness threshold is 77). |
A program Text Classifier that implements the suggested technology has been described and its results demonstrated on a real-world example. Text Classifier is currently used in the Mayor Directorate of Moscow City Government for the work with a large textual database, “Sustainable development of cities of Russia;” it also is being tested in the Department of Environment Protection of Mexico City Government for working with the text archive of ecological data. Our further work on the program will be aimed at the improvement of the visual representations.
References
Alexandrov, Mikhail, Alexander Gelbukh, and Pavel Makagonov (2000). Some Keyword-Based Characteristics for Evaluation of Thematic Structure of Multidisciplinary Documents. Proc. of CICLing-2000, International Conf. on Intelligent text processing and Computational Linguistics, CIC-IPN, Mexico City.
Andriaans, P., and D. Zantinge. (1997): Data Mining. Addison-Wesley, 159 pp.
Gordon, A.D. (1996): Cluster Validation. In Proceedings of 5-th Conf. of IFCS “Data Science, Classification and Related Methods” (Kobe, Japan), Springer, pp. 22-39.
Guzman-Arenas, A. (1998). Finding the main themes in a Spanish document. Intern. J. Expert Systems with Applications, v. 14, N 1/2, 139-148.
Joliffe, I.T. et al (1988):Stability and influence in cluster analysis. In E. Diday (Ed.). Data Analysis and Informatics, Vol. 5, Amsterdam, pp. 507-514.
Klawonn, F., and R. Kruse. (1995): Derivation of fuzzy classification rulesfrom Multidimensional data. In Proceeding of the Intern. Conf. IDA-95 “Advances in Intelligent Data Analysis” (Baden-Baden, Germany), Intern. Institute for Advanced Studies, Canada, pp. 91-94.
Makagonov, P., Alexandrov, M., and Sboychakov, K. (1999): Searching in full text Data Bases by using text patterns. In Pedro Galicia (Ed): Proceedings of International Computer Symposium CIC’99. National Polytechnic Institute, Mexico, 17-29.
Windham, M. (1981): Cluster validity for fuzzy clustering algorithm. J. Fuzzy Sets and Systems, N 5, pp. 177-185.
Mikhail Alexandrov is a professor and researcher of the Natural Language Processing laboratory of the Computing Research Center (CIC) of the National Polytechnic Institute (IPN), Av. Juan Dios Bátiz s/n esq. Mendizabal, col. Zacatenco, CP 07738, DF, Mexico. His main interests include mathematical modeling and mathematical methods of classification and clusterization. He can be reached at dyner@cic.ipn.mx.
Alexander Gelbukh is a professor and researcher and the head of the same laboratory. He is author of about 90 publications in the field of computational linguistics, including computational morphology, syntax, semantics. He can be reached at gelbukh(?)cic.ipn.mx or gelbukh(?)earthling.net, see also http://www.Gelbukh.com.
Pavel Makagonov is the Deputy Chief of the Moscow Mayor’s Directorate of the Moscow City Government, Novi Arbat 36, 13-th floor, Moscow 121205, Russia. His main interests include the problems of megapolis management, statistical methods of decision making, mathematical and visual methods of classification and clusterization. He can be reached at makagon@maria3.munic.msk.su.
The work was done under partial support of CONACyT, REDII, and CGEPI-IPN, Mexico.